Breaking Down the Bears' 2025 Passing Game by Route
Caleb Williams showed real growth in his second season. His Y/A jumped to 6.9, his PFF deep ball grade went from 56.4 to 95.5 (5th among QBs), and his big-time throw rate hit 30% (top-10 among starters). Ben Johnson’s offense was built around explosives, and when you look at the route-level data, you can see exactly how that played out.
Pulling the data
All of this analysis uses nflverse play-by-play data. Loading it and filtering down to Bears pass plays is straightforward:
library(tidyverse)
library(nflreadr)

pbp <- load_pbp(2025)

bears_passes <- pbp %>%
  filter(posteam == "CHI", play_type == "pass", !is.na(route))
From there, we can compute EPA per play by route type and compare to league average:
league_avg <- pbp %>%
  filter(play_type == "pass", !is.na(route)) %>%
  group_by(route) %>%
  summarise(lg_epa = mean(epa, na.rm = TRUE))

caleb_routes <- bears_passes %>%
  filter(passer_player_name == "C.Williams") %>%
  group_by(route) %>%
  summarise(
    attempts = n(),
    epa_play = mean(epa, na.rm = TRUE)
  ) %>%
  left_join(league_avg, by = "route") %>%
mutate(epa_vs_avg = round(epa_play - lg_epa, 2))Caleb’s EPA by route type
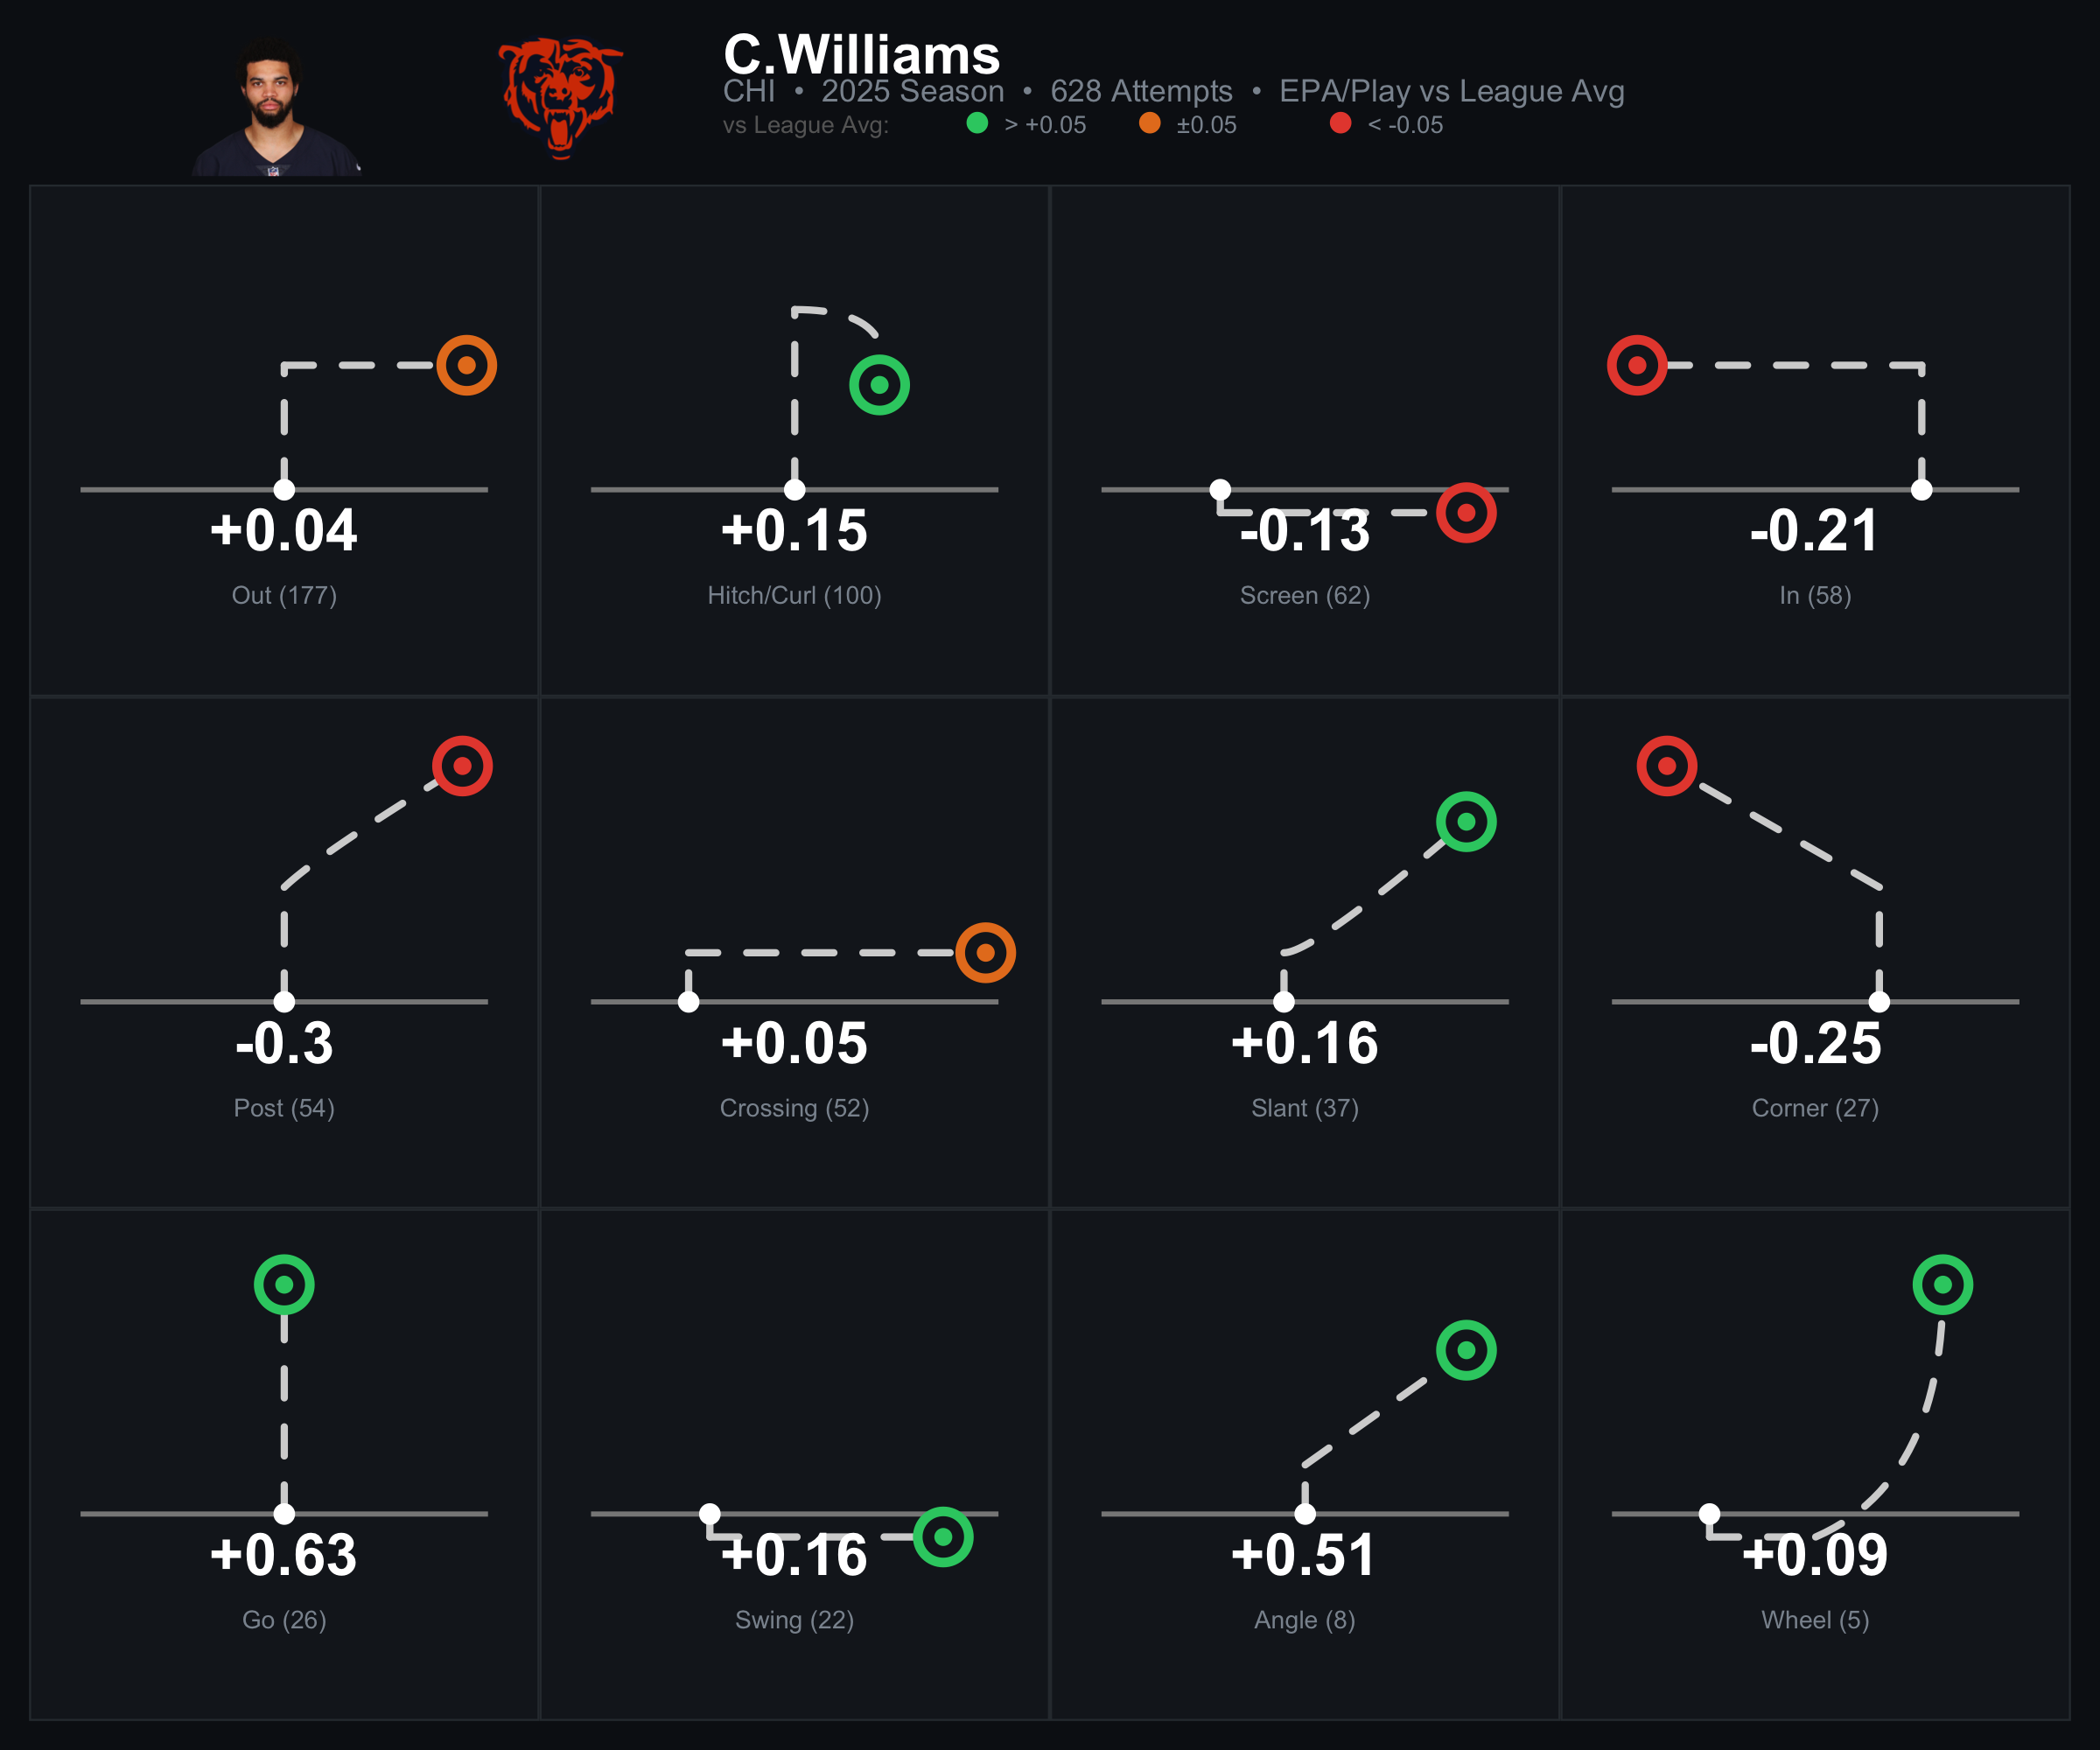
This chart shows Williams’ EPA per play versus league average across all route types on 628 attempts. Green means above average by more than 0.05, orange means roughly average, red means below.
Go routes at +0.63 EPA vs. average is elite. On only 26 attempts, Caleb was one of the most efficient deep ball throwers in the league. That tracks with the broader deep ball numbers: his PFF grade on 20+ yard throws jumped from 56.4 to 95.5 (5th in the NFL), and he finished 12th in deep pass completion percentage among starters after ranking 32nd as a rookie. Angle (+0.51) and Slant (+0.16) also popped. He’s comfortable with routes that give him a clear, quick read. Hitch/Curl (+0.15) on 100 attempts is solid, high-volume and above-average. That’s your bread and butter.
Out routes (+0.04) were his most-called route at 177 attempts but barely above average. Lots of volume, minimal edge. Post (-0.30) and Corner (-0.25) show negative EPA, but this needs context. These routes have inherently lower completion rates, and Caleb was taking more aggressive shots downfield than almost anyone in the league (only 8 starting QBs had longer intended air yards per pass). The EPA reflects the risk baked into an explosive-oriented scheme more than a lack of ability on those concepts. A 95.5 PFF deep grade and a top-10 BTT rate say the arm talent and decision-making on those throws were legitimately good. In routes (-0.21) and Screens (-0.13) round out the negatives. The screen number is worth noting since that’s supposed to be a low-risk play.
The overall picture: the offense was designed to push the ball downfield and generate explosives. Caleb’s quick game (hitch, slant) was efficient, and his vertical shots (go, angle) were elite. The intermediate-to-deep routes show negative EPA partly because that’s what happens when you’re attacking aggressively, not because Caleb can’t make those throws.
How the receivers were deployed
We can also break down each receiver’s route distribution and catch rates:
wr_routes <- bears_passes %>%
  filter(receiver_player_name %in%
    c("R.Odunze", "D.Moore", "L.Burden", "C.Loveland")) %>%
  group_by(receiver_player_name, route) %>%
  summarise(
    targets = n(),
    catches = sum(complete_pass, na.rm = TRUE),
    catch_rate = round(catches / targets * 100, 1),
    .groups = "drop"
  ) %>%
  group_by(receiver_player_name) %>%
  mutate(target_share = round(targets / sum(targets) * 100, 1)) %>%
  arrange(receiver_player_name, desc(target_share))
The route tree charts for each receiver tell us how the coaching staff schemed around Williams’ strengths and limitations.
Rome Odunze (101 targets)
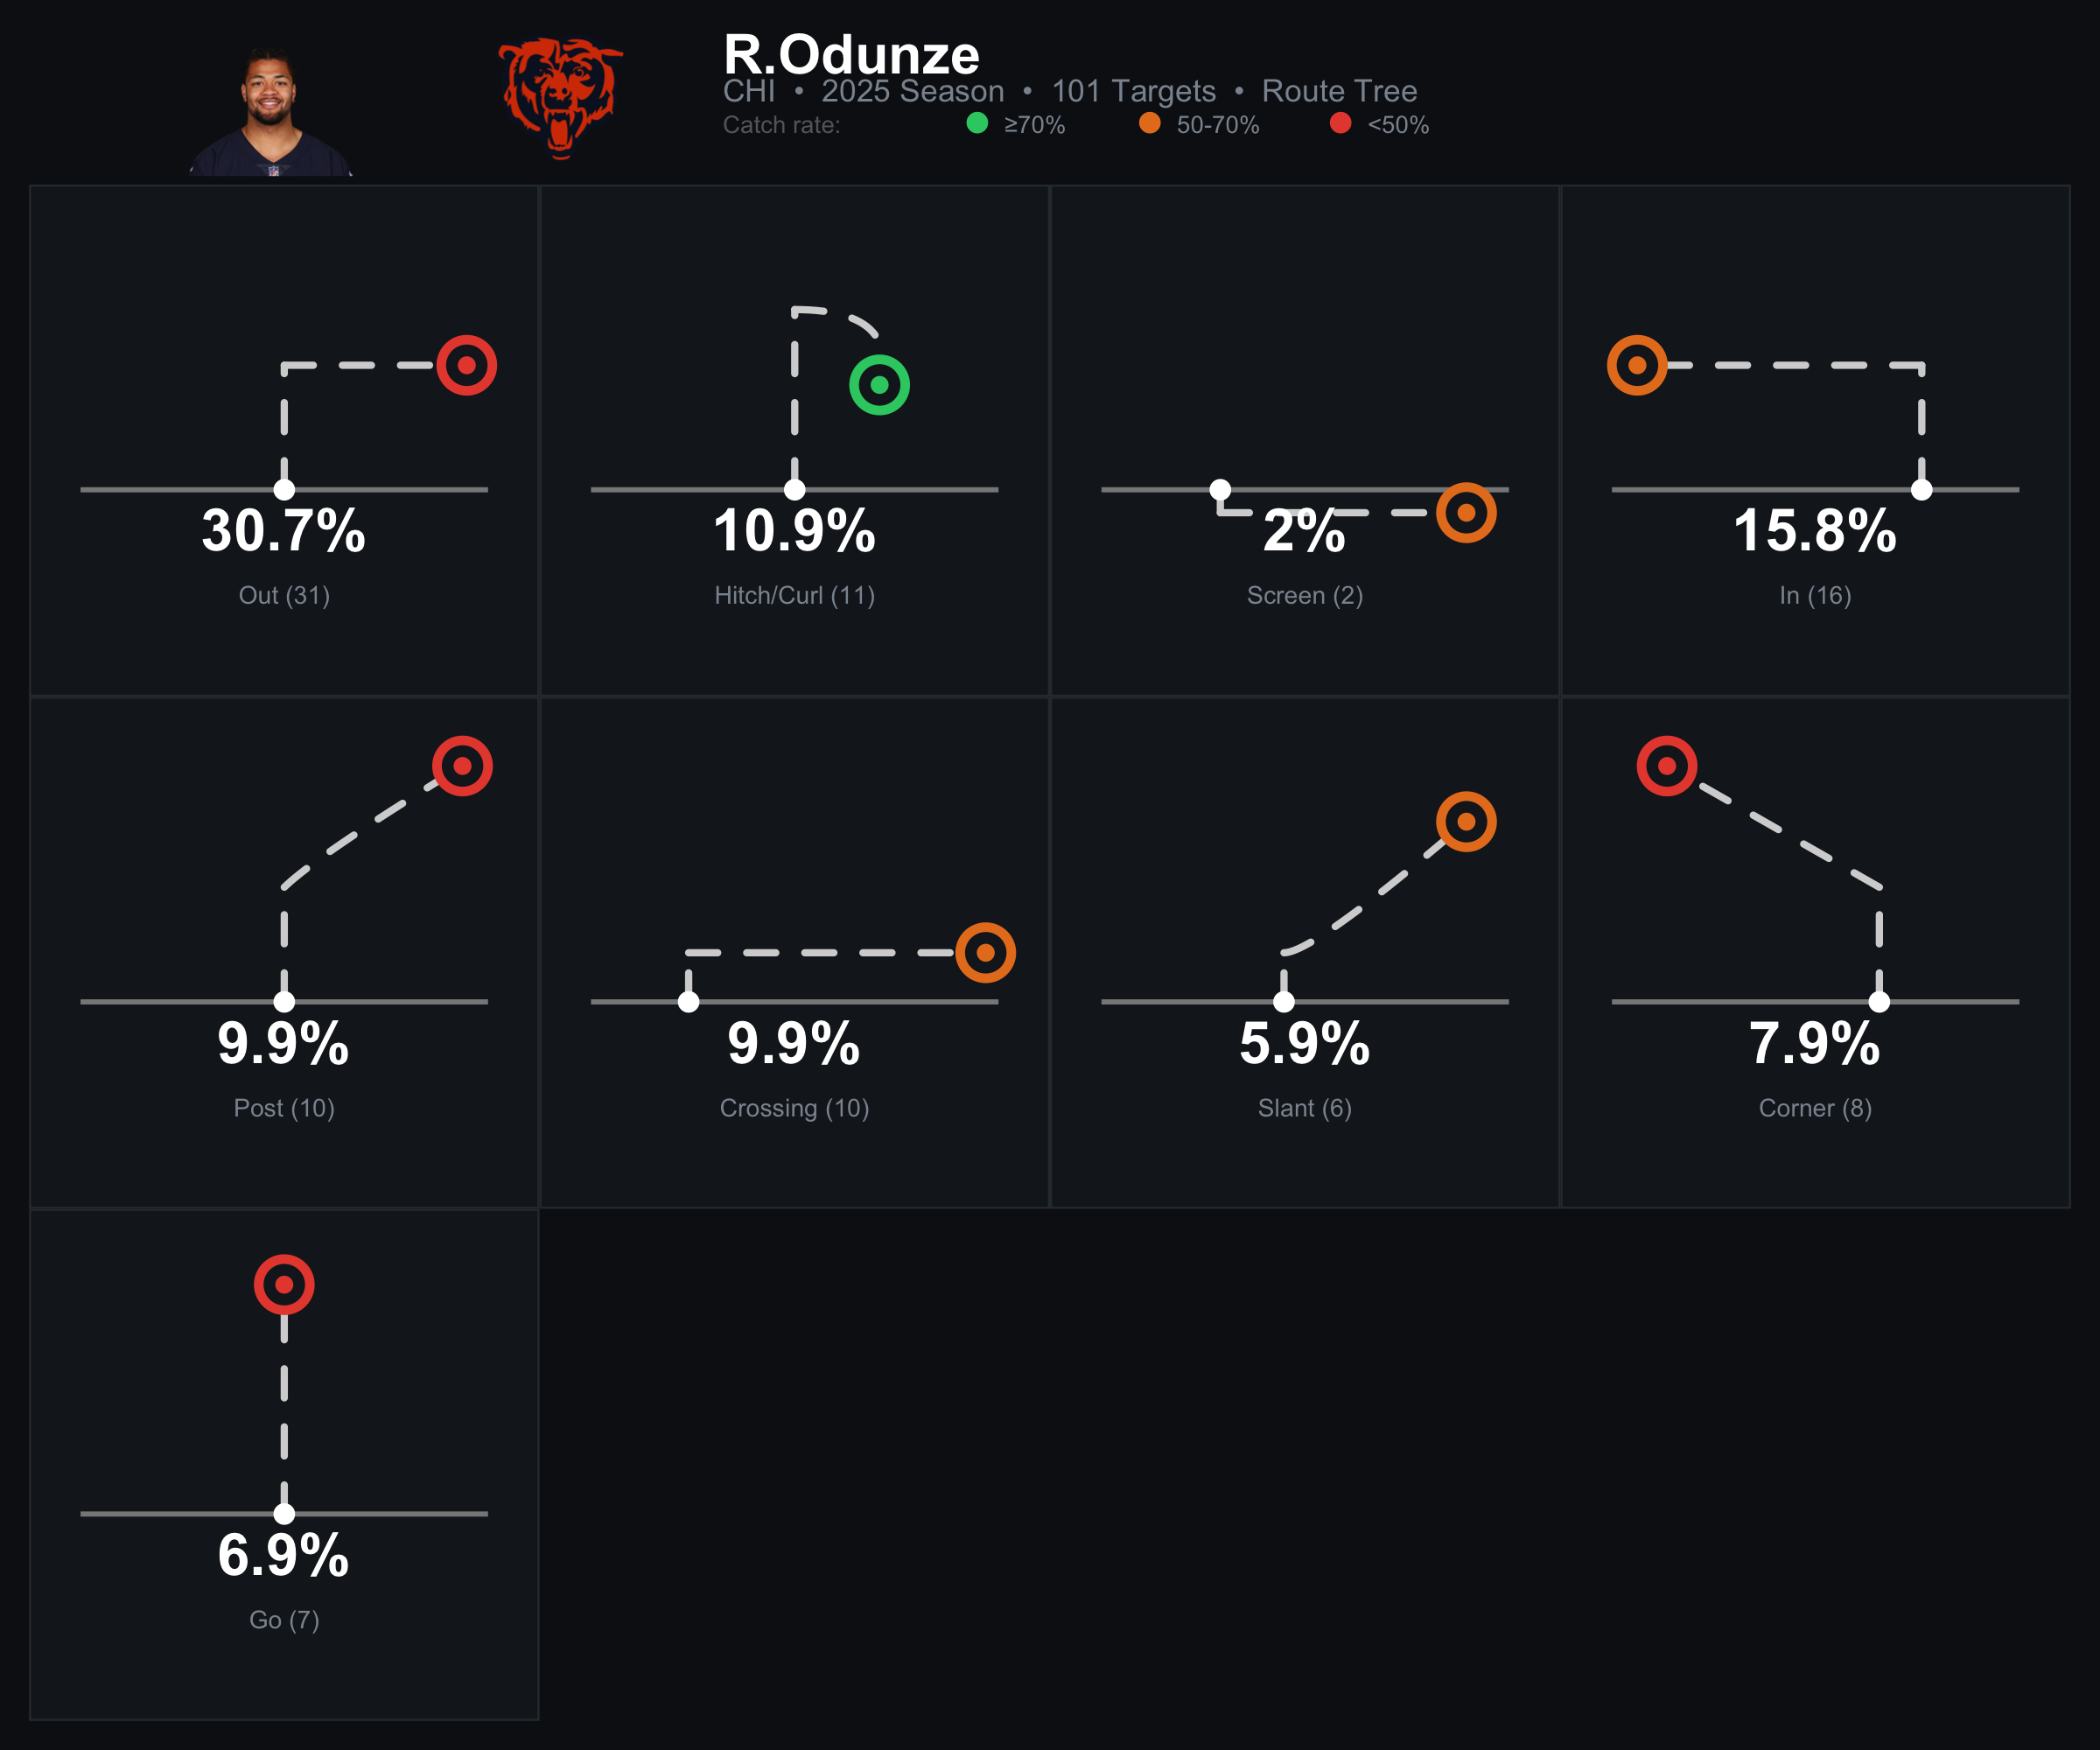
Odunze’s route tree is concerning. Nearly a third of his targets (30.7%) came on out routes, with almost all of his catch rates in red or orange. His only green route is hitch/curl at 10.9% of targets. He was asked to win on posts (9.9%), corners (7.9%), and go routes (6.9%), all with sub-50% catch rates.
The Bears’ pass catchers were charged with 29 drops on the season, fifth-most in the NFL. Odunze contributed to that number. He’s a second-year receiver running a ton of contested routes and not converting enough of them. Some of that falls on Caleb (posts and corners are his worst routes by EPA), and some of it is on Odunze’s hands in traffic. The out-route volume is particularly rough: 30.7% of targets on a route where the catch rate is below 50%. Ben Johnson has already said improving the drop rate is a “point of emphasis” this offseason.
DJ Moore (100 targets)
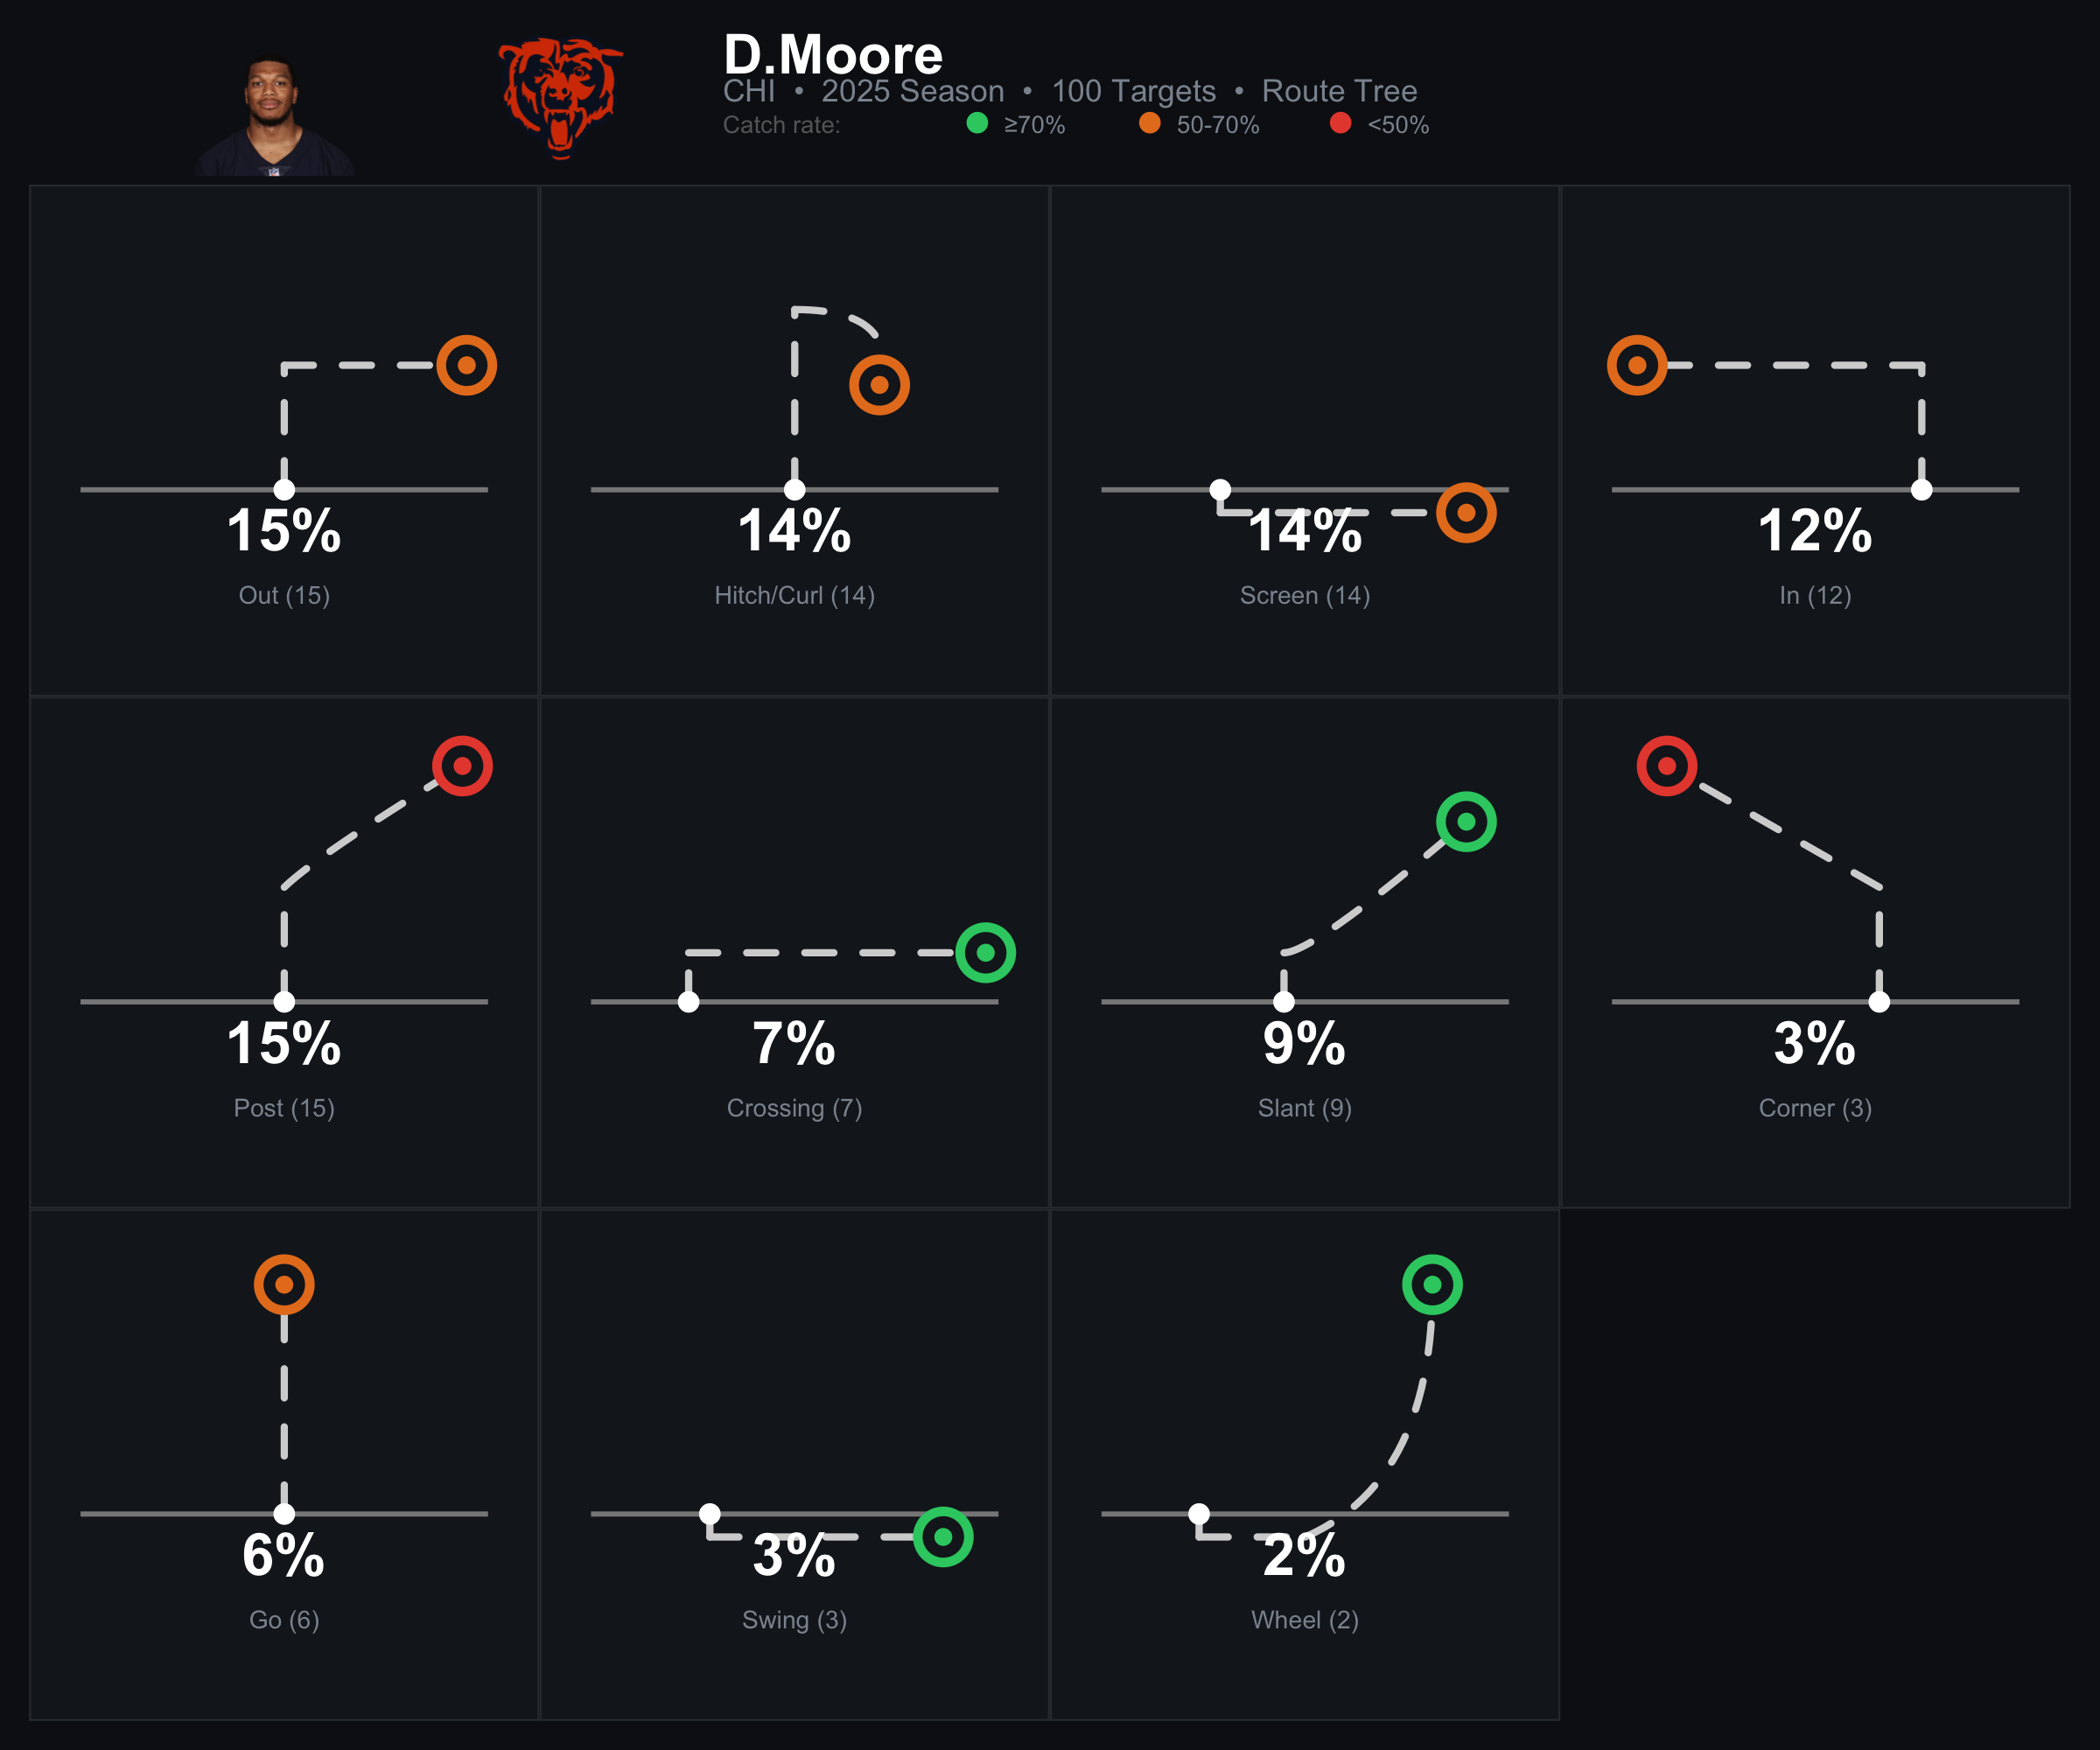
Moore’s distribution is the most balanced of anyone on the roster. Out (15%), post (15%), hitch/curl (14%), screen (14%), in (12%). He’s being used as a full-tree receiver, which makes sense given his experience and route-running ability.
Balance doesn’t mean production, though. Moore’s overall PFF grade dropped to 73.5, a steep fall from the 89.0 he earned in his first year with the Bears. His receiving grade (72.8) tells the same story. The green catch rates on slants and crossers are real, but those are low-volume routes. On the concepts that make up the bulk of his work, he’s middling. His post catch rate is red, which tracks with Caleb’s EPA on posts, so that’s not entirely on Moore. Still, he went from being the clear WR1 to being a trade candidate this offseason, and the route tree data explains part of why: he’s running everything, excelling at nothing.
Luther Burden (74 targets)
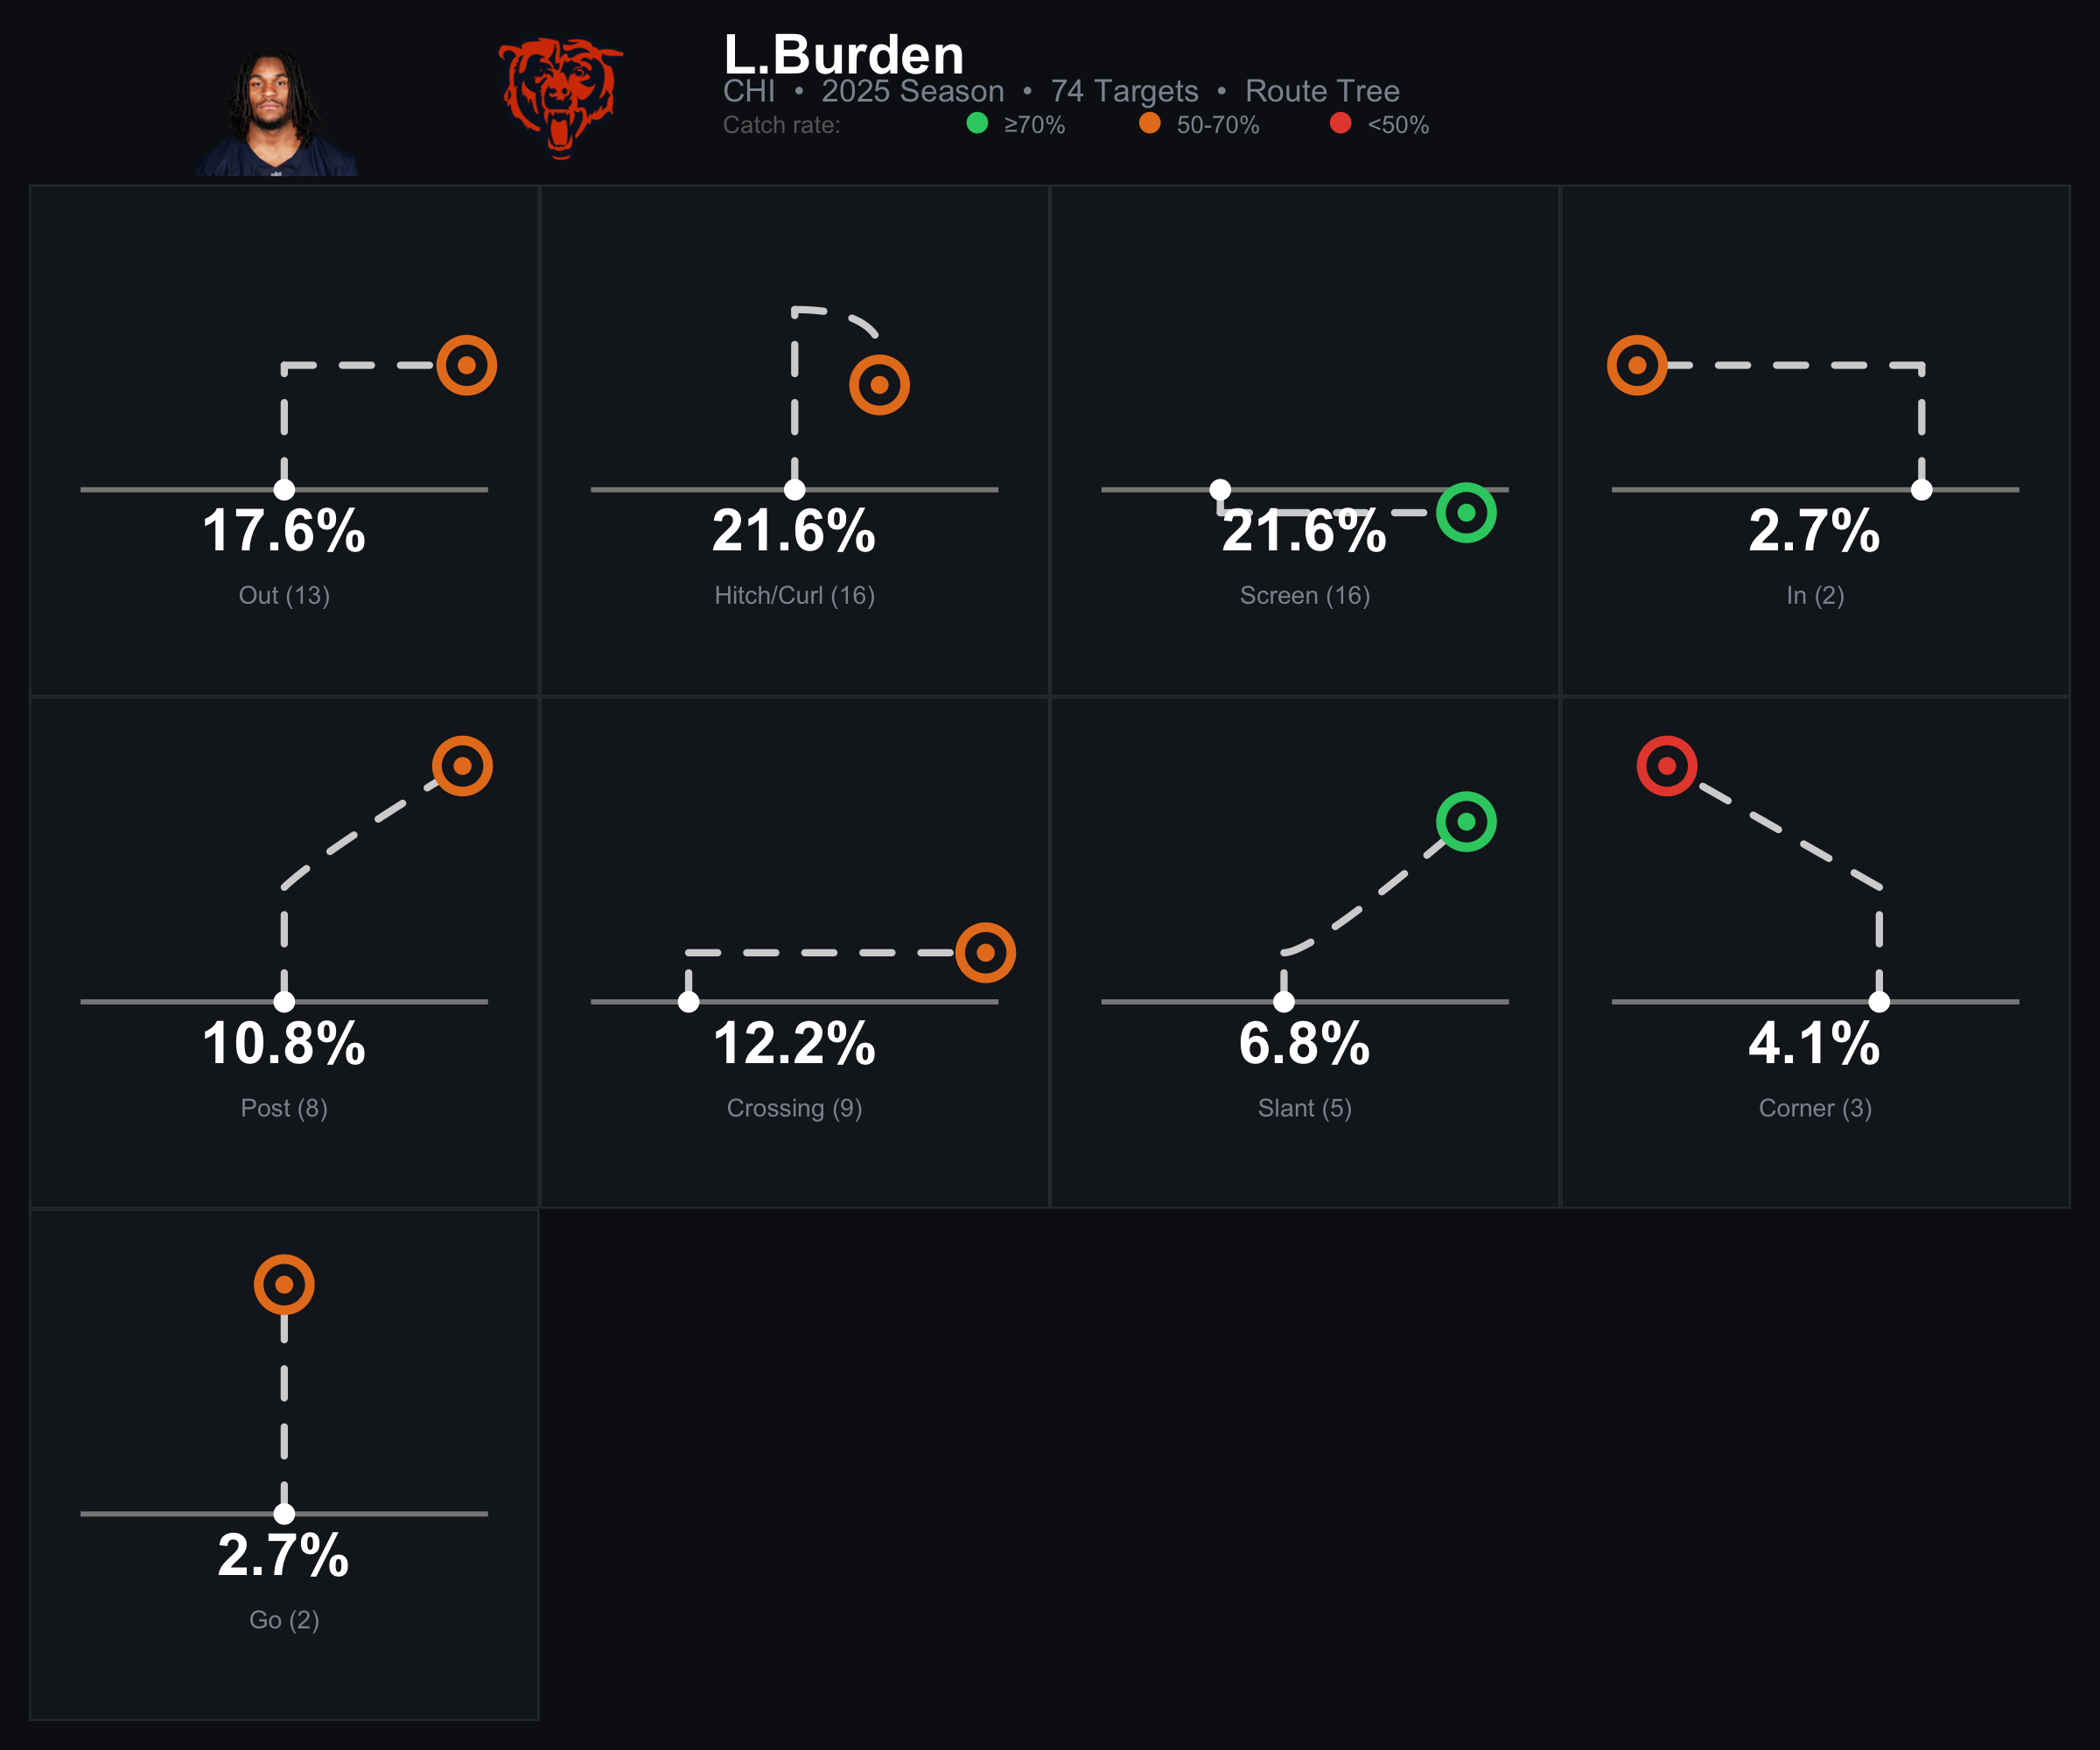
Burden’s target distribution looks limited on paper, with hitch/curl (21.6%) and screen (21.6%) accounting for nearly half his work. But what he did with those targets was historic. His 2.23 yards per route run ranked in the top seven rookie WR seasons since PFF started tracking in 2011. He led the team in YAC per reception (7.0) and forced missed tackles. He wasn’t just running screens and falling down. He was creating after the catch at an elite level.
The route tree is narrow by design. The coaching staff funneled targets to Burden on concepts where Caleb is most comfortable (quick game, screens) and Burden turned that volume into one of the best rookie receiving seasons in recent memory. The post usage (10.8%) at an orange catch rate hints at room to grow. If the Bears expand his route tree in year two, the production ceiling gets interesting.
Colston Loveland (81 targets)
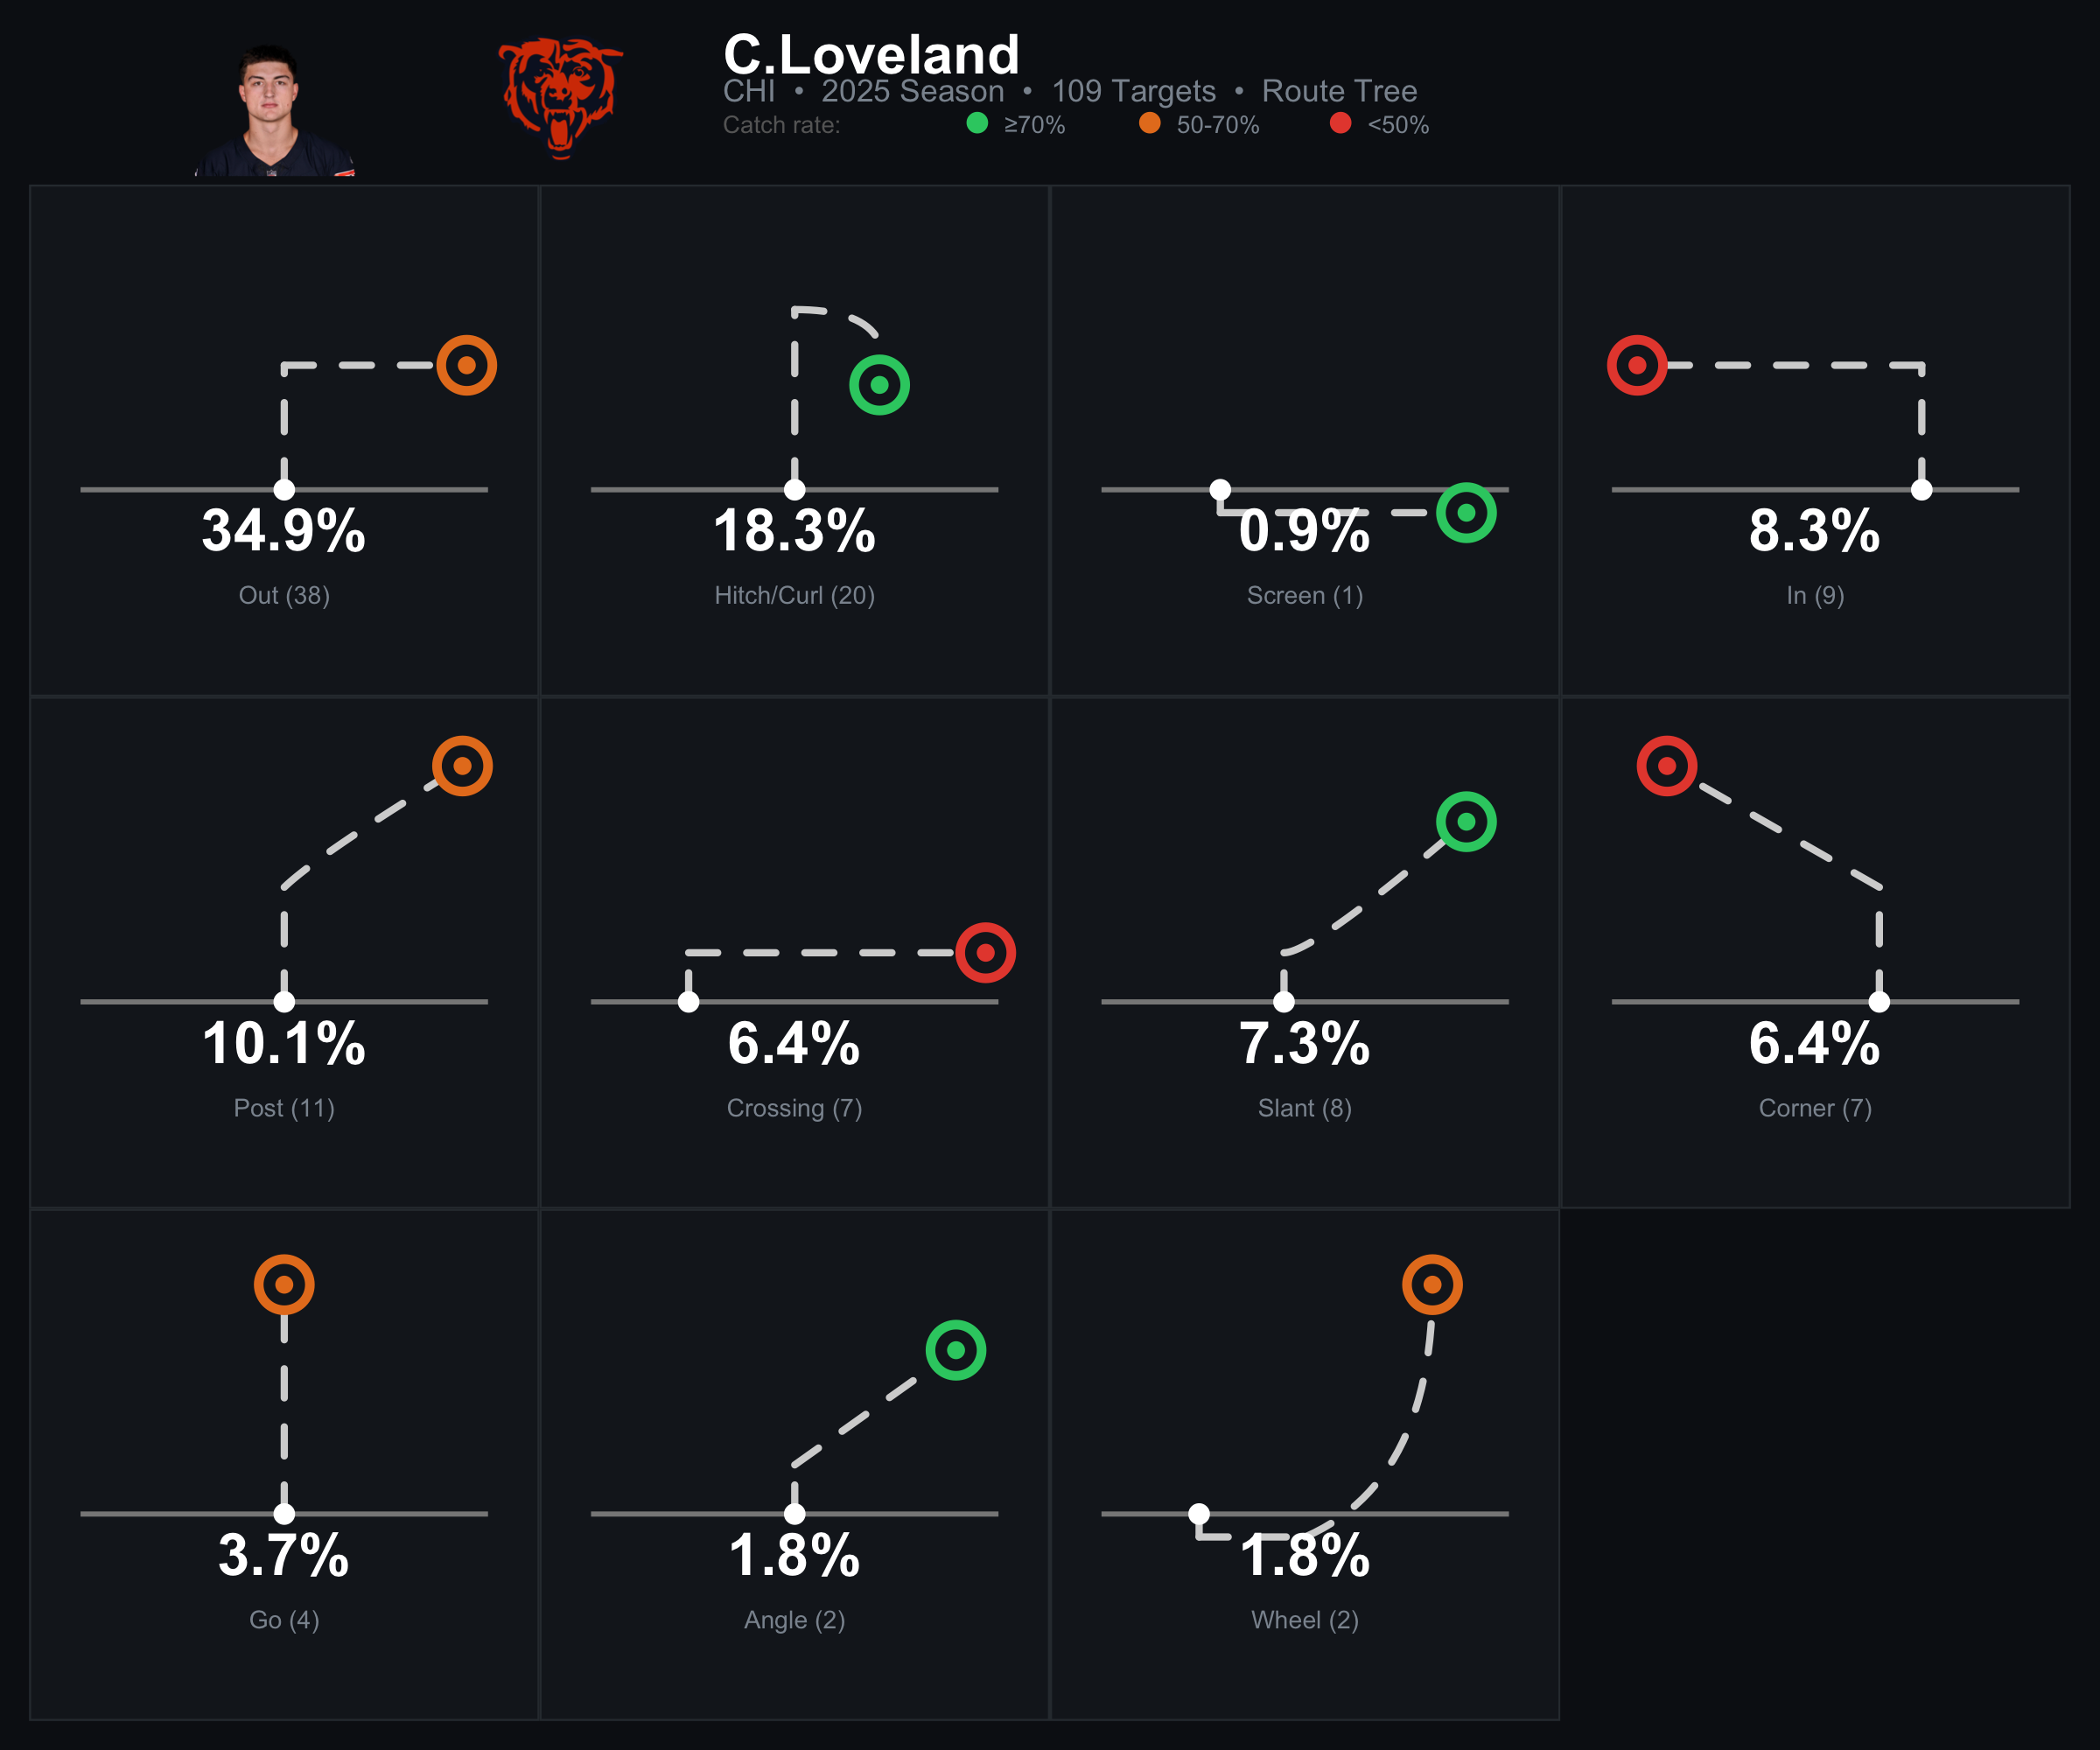
Loveland was the best rookie in football. PFF graded him at 85.3 overall, the highest mark for any rookie regardless of position. His 86.2 receiving grade was second among all tight ends in the league. He played 818 snaps and led the team in WAR. As a rookie.
His route tree shows why. Loveland operates in the intermediate space where Caleb has historically struggled, but the catch rates are green where it counts. Crossers, screens, intermediate digs: the routes that require a reliable target over the middle. The Bears’ post and in-route EPA problems look a lot less concerning when you realize Loveland is the answer to that gap. Funnel those intermediate targets to a tight end with elite hands and an 85+ PFF grade instead of forcing them to receivers running contested routes downfield. The coaching staff clearly figured this out as the season went on.
What this adds up to
The Bears’ passing game under Ben Johnson was built around explosives. The route distribution shows an offense that leaned into Caleb’s aggressive downfield tendencies, and the production data says that was largely the right call. His deep ball was genuinely good this year.
Odunze’s usage is the biggest mismatch. He’s running the hardest routes at the highest volume with the worst catch rates. Either the coaching staff adjusts his tree to play to his strengths, or Caleb needs to improve his anticipation on posts and corners. Probably both.
Moore ran the most diverse route tree and his production still declined across the board. A 73.5 PFF grade and growing trade buzz suggest the Bears might be ready to move on. Meanwhile, Burden was a top-7 rookie by YPRR ever, on a deliberately narrow route tree. Expanding his usage in year two is one of the highest-upside moves the offense can make.
And then there’s Loveland. The highest-graded rookie in the NFL, filling the exact intermediate gap that Caleb’s EPA data says is the biggest problem. That’s the most important piece of this whole offense going into 2026.
Caleb’s Y/A, deep ball grade, and big-time throw rate all took real jumps from his rookie year. The route EPA on posts and corners is negative, but a 95.5 PFF grade on 20+ yard throws (5th in the NFL) tells a more complete story. The development is there. The 2025 data gives you a roadmap for what this offense should look like next year: keep leaning into the explosives where Caleb is already producing, fewer forced out routes to Odunze, and let Loveland own the intermediate middle of the field.
Data from the 2025 NFL season via nflverse.